K-12 School Shooting Statistics: 52 Years of Data

Since 1970, there have been 2,057 incidents involving the discharge of a firearm on school property and 680 people have died.

K-12 School Shooting Statistics: 52 Years of Data

The Naval Postgraduate School‘s Center for Homeland Defense and Security (CHDS) K-12 school shooting database documents every instance a gun is wielded, fired, or a bullet hits school property for any reason.

This article, originally published in 2018, was last updated on Oct. 5, 2023, to reflect current statistics.

While this data is important and may be intimidating, we want to emphasize that active shooter events in schools are still extremely rare. There are many layers to keeping schools secure and students and staff safe. Active shooter response should only be part of your campus safety plan — not all of it. 

Additionally, this data includes all incidents where a firearm was discharged — not just mass shootings.


The Naval Postgraduate School‘s Center for Homeland Defense and Security (CHDS), in conjunction with the Federal Emergency Management Agency (FEMA), maintains a K-12 school shooting database project as part of their Advanced Thinking in Homeland Security program. They found the need for accurate, detailed information on this subject was paramount to campus safety.

The database documents every instance a gun is brandished, fired, or a bullet hits school property for any reason, regardless of the number of victims, time, day of the week, or reason.

As we continue to recover from the pandemic, mental health concerns among young people continue to skyrocket and many weapons have been confiscated from schools. Some districts have even taken or considered taking significant measures to prevent weapons from getting inside, including banning backpacks and installing metal detectors in middle schools. Once unfathomable situations, like a six-year-old taking a gun to school and shooting his teacher, are becoming reality.

While the incident in Newport News is hardly normative, it does make most pause and wonder what it is that’s causing this increase in concerning behaviors. No matter one’s beliefs on what might solve the youth mental health and gun violence epidemics, looking at the raw data and understanding the various factors that may have caused or led up to an incident will offer insight into ways to prevent and mitigate.

You can find the entire database here but we will highlight some of the important findings below.

K-12 School Shooting Statistics

The school shooting data below includes stats from 1970 to June 2022. Partial 2023 data is included in the first two bullets and can be found on the CHDS website.

  • There have been 2,069 shooting incidents since 1970.
  • There have been 684 fatalities and 1,937 injuries.
  • 2021 had the greatest number of incidents with 249. The next highest year was 2022 with 153 (note this only includes through June).
  • Since 1970, there have been 573 fatalities and 1,623 injuries.
  • 2022 was the deadliest year with 50 victims killed — 21 of whom died in the Robb Elementary School shooting.
  • California, Texas, and Florida are the states with the most incidents.
  • The most common location for a school shooting is in a parking lot (22.6%), followed by inside a classroom (9.8%).
  • Most school shootings occurred during morning classes (18.1%), followed by during afternoon classes (10.3%) and sporting events (10.1%).
  • The most common situation was an escalated dispute (37%).
  • The most common time of year for a school shooting is in the fall (40%).

The CHDS has compiled all of their K-12 school shooting statistics in graphs, tables, and charts.

We put together a slideshow of these graphs for you to view here. Each slide has a link to an interactive map with more detailed information.

K-12 School Shooter Statistics

Here are some statistics specific to the shooters:

  • In 934 incidents (43.1%), the shooter was a current student at the school.
  • 442 shooters (20.4%) had no school affiliation.
  • In 1,043 incidents, the shooter targeted specific victims. In 296 incidents, the victims were random. In 219 incidents, the victims were both targeted and random.
  • The average age of the shooters is 20.
  • The most common age of a shooter is 17, followed by 16, 18, and 15.
  • The shooter was male in 1,838 incidents and female in 87.
  • The most commonly used weapon was a handgun or multiple handguns, which were used in 1,445 incidents. A rifle or multiple rifles were used in 114 incidents.
  • In 220 incidents, the shooter died, largely from suicide (86%).

What Defines a School Shooting?

To gather detailed and accurate data, the CHDS had to come up with a definition of a school shooting to decide which incidents made it into the database. Their definition is any time “a gun is brandished, is fired, or a bullet hits school property for any reason, regardless of the number of victims (including zero), time, day of the week, or reason.”

Some criteria questions to consider when determining if an incident is actually a school shooting are:

  • Did the shooting occur at a location defined as an educational institute for children?
  • Does it need to be inside a school building on school property?
  • Are shootings that occur on school buses considered a school shooting?
  • Is a student committing suicide with a firearm inside the school considered a school shooting?
  • Do there need to be victims in order for it to be classified as a school shooting?
  • What if non-students shoot at other non-students and the bullet hits a student bystander?

The CHDS says choosing to include or exclude factors like these can directly affect the statistical narrative on school shootings. Through exclusion, fewer incidents will be reported. Partial or incomplete inclusion will increase the number of reported incidents.

Research & Methodology

After defining what a school shooting was, the CHDS followed a four-step process to populate the school shooting database.

1. Database Compilation and Preliminary Research

An open-source analysis was conducted to determine all of the available data on school shootings. After reviewing the existing data, the information from each of the different databases was compiled into a single spreadsheet.

2. Detailed Research

Newspaper archives were frequently used to find accurate information on school shootings, although some would only give the school name, shooter’s name, or victim’s name. Cross-referencing the information from multiple newspaper articles provided the most open-source information and best corroboration reasonably available.

To assist in identifying data and sorting information, a set of categories were established to provide context for the cause of the shooting. The top categories can be found in the chart below. The full interactive chart can be found here.
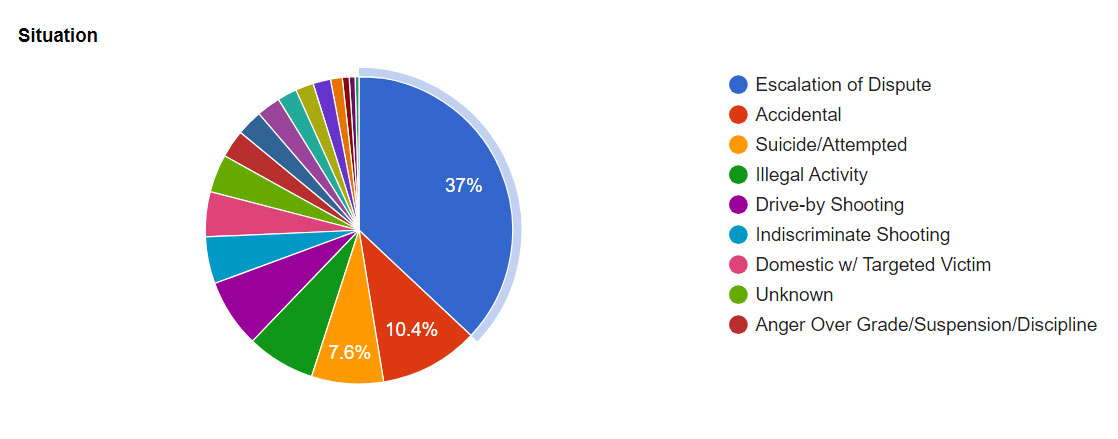
k-12 school shootings

Graphic source: CHDS

3. Reliability Score and Validation of Research with Official Documents

The information in the database is open-source from online and print news. The validity of the information about each incident was quantified with a reliability score of one to five (five being the most reliable).

  1. Blogs
  2. Single newspaper article or online news report
  3. Multiple news sources
  4. Hundreds of news sources or statements/interviews from law enforcement officials
  5. Court records or police report

4. Validation with Official Sources

The goal is to have every incident in the database have a reliability score of five. Each of the school shootings in the database includes a date, school name, city, and state.

Now view the slideshow here.

Beginning the process of addressing the potential threat of a shooter at your school can be overwhelming. Here are some resources to help.


Disclaimer from CHDS website: This is an official Department of the Navy (DON) Website (Government Information Locator Service Number: DOD-TBD-001923). This information service is provided by the Naval Postgraduate School (NPS) for the public viewing and retrieving of information. Unless otherwise indicated, information on this service represents official, unclassified NPS, DON, or Department of Defense (DOD) policies or positions.

If you appreciated this article and want to receive more valuable industry content like this, click here to sign up for our FREE digital newsletters!

About the Author

Contact:

Amy is Campus Safety’s Executive Editor. Prior to joining the editorial team in 2017, she worked in both events and digital marketing.

Amy has many close relatives and friends who are teachers, motivating her to learn and share as much as she can about campus security. She has a minor in education and has worked with children in several capacities, further deepening her passion for keeping students safe.

Leading in Turbulent Times: Effective Campus Public Safety Leadership for the 21st Century

This new webcast will discuss how campus public safety leaders can effectively incorporate Clery Act, Title IX, customer service, “helicopter” parents, emergency notification, town-gown relationships, brand management, Greek Life, student recruitment, faculty, and more into their roles and develop the necessary skills to successfully lead their departments. Register today to attend this free webcast!

24 responses to “K-12 School Shooting Statistics: 52 Years of Data”

  1. Thomas Davis says:

    This number is skewed. This makes it sound like there are actual attacks in schools or at schools when many of these are incidents that have nothing to do with attacks on the school or attacks on personnel or students. Look, any amount of shootings anywhere are too many but the way you are presenting it is not responsible. Thanks.

  2. Can you please tell me where your statistics came from in regards to the US having 82 school shooting incidents in 2018.
    One of the curriculums I teach is Active Shooter Response Training, along with the Aftermath and Recovery.
    Besides owning a business that provides this type of training, I work as the Public Safety Training & Education Coordinator for a large HealthCare Company (we have 9 hospitals in our system).
    I brought the Active Shooter program into our system, and I also do lots of research on active shooter events, and attend 10-12 webinars and in person seminars on the subject each year.
    I cannot find the number of school shooting incidents at 82, anywhere, some sources say we had 5, some say 7, but the most I’ve found is 11.
    The statistic of 82 seems far fetched to begin with, and was the reason I researched that number, I would be interested to know your source, please

    • Katie Malafronte says:

      Hi Dominick,

      This database was put together by the Naval Postgraduate School’s Center for Homeland Defense and Security. Our article explains that this database is put together off of their definition of what makes an incident a “school shooting,” which they have defined as, when a “gun is brandished, is fired, or a bullet hits school property for any reason, regardless of the number of victims (including zero), time, day of the week, or reason.” This could be why the numbers you’ve found are different. All of the slides can be found here https://www.chds.us/ssdb/category/graphs/.

  3. Dr. Zach Campbell says:

    “Firearm related incidents” is a far better, and more accurate title.

  4. Gary Valentine says:

    This report is very skewed. Id the information is to be valid in determining the number of active violence on school grounds or related activities the reporting need to be broken down as follows.

    1. Number of incidents that involved enrolled students and occurring inside a school.
    2. Number of incidents occurring on school grounds during school hours involving students.
    3. Number of incidents occurring school hours on school grounds not related to enrolled students.
    4. Number of incidents occurring a school sanctioned sporting event.

    Additionally, breaking it out further to include weapon type and number of injured in each incident. Parameters should also separate known reason for violence. Eliminate things that are not directly related to the education of or sporting events for students gives a clearer picture to what is happening in our schools.

    I like the report the way it breaks down day of week, time of day etc. but we need accurate figures involving our students during a school sanctioned event.

  5. Conrad Stroebe says:

    You should read and react to research done by David A Kaiser on school shootings!

  6. JT Nunley says:

    Part of the problem is having an entity that doesn’t normally keep statistics on crime and then breaking those numbers down in a manner that law enforcement keeps statistics. This organization obviously doesn’t. Anyone that is reviewing these numbers should consider WHO put these numbers together and WHAT is their vested interest.

    There are things within this report that should cause concern for the reader regarding its accuracy. By this, I mean:

    1. The definition of a firearm (A) any weapon (including a starter gun) which will or is designed to or may readily be converted to expel a projectile by the action of an explosive; (B) the frame or receiver of any such weapon; (C) any firearm muffler or firearm silencer; or (D) any destructive device.

    2. A BB gun and pellet gun are not true firearms from the definition provided above. I understand that schools have a no tolerance rule however, to accurately reflect a firearm would mean to delete these two from their statistics.

    3. Showing or listing a police officer/SRO in the statistics is also skewed. If they are addressing a threat, then that threat must be armed in some form or fashion. Those that they are addressing, are they engaging an active shooter in the school or are they apprehending a suspect from a crime that led police to the location of a school? As a 32 year veteran of law enforcement and an active shooter instructor, I have many questions as to the specific incidents and to the accuracy of this report.

    4. Any firearm on school property is a or should be considered a threat but there are exceptions. The one exception is a firearm possessed or carried by a law enforcement officer/SRO. He is (or should be) there in defense of students and staff members. One question that should be posed is what is the individual’s intent with that firearm? My next question is if they keep statistics on firearms present on a school campus, are they going to count the firearm carried by law enforcement or SRO? Along with these numbers, there are many schools that are now allowing teachers and/or staff members to be armed. If they include a firearm possessed by a teacher/staff member, then again these numbers would be inaccurate.

    My point is instead of lumping everything together, they should look at each incident, individually, and ask many questions to reflect accuracy in their report.

    jamestnunley@outlook.com

  7. JMoss says:

    I find it very alarming that they have every statistic on the matter of school shootings but not the race of the student. Lack of information is why people in this country continue to think that only black peoples commit crimes. Please update.

  8. kelon says:

    this website really helped alot with my activist school shooting progress.

  9. Mindy Holland says:

    Do school shootings happen more frequently in school libraries than in other locations in the building? Are school libraries often a safe spot? I’m looking for any data regarding school libraries, school librarians and school shooting. Thanks for any help you can provide.

  10. Anon says:

    “This database was put together by the Naval Postgraduate School’s Center for Homeland Defense and Security. Our article explains that this database is put together off of their definition of what makes an incident a “school shooting,” which they have defined as, when a “gun is brandished, is fired, or a bullet hits school property for any reason, regardless of the number of victims (including zero), time, day of the week, or reason.” This could be why the numbers you’ve found are different. All of the slides can be found here https://www.chds.us/ssdb/category/graphs/.”

    “or a bullet hits school property for any reason, regardless of the number of victims (including zero)” <<< You don't find this figure misleading?

  11. Jean Esplin says:

    According to this article, slightly more than half the shootings involved more than half these events involved a person who was a current student at the school. This means that, in addition to traumatizing students, active shooter drills provide a future shooter a good look at the school reaction plans. While teachers should receive training, thinking twice about proving students with that information might be a good idea.

  12. […] 2018, there were 82 reported school shootings across the United States – the highest rate since 1970. A total of 51 victims were […]

  13. […] 2018, 51 people were killed in 82 school shooting incidents. This is the highest number of shootings and the highest number of fatalities since experts started […]

  14. Stacey says:

    I find it interesting how so many comments are picking apart the findings instead of asking how can we come together to find a solution to this blatant crisis in America, especially after the last shooting in Oxford HS. I also am perplexed but not really at how detailed the stats are regarding school shootings and the seriousness of them but not once was race ever mentioned. Truth be told, the majority of shooters are white males and if you don’t visit that fact then you are doing a disservice to the safety of the student body population in particular schools.

  15. Barbara McCullough says:

    1966 Charles Whitman – University of Texas. Murdered total of 14 on campus plus murdered his wife and mother by stabbing them to death before he went to the college.

  16. Ray Naylor says:

    I’d like to know how many of the inside the school shooters had contact with staff, law enforcement and or mental health services specifically related to threats of shooting or violence. It seems an elusive statistic and there is a very narrow window, first day to maybe third day after to find mention of it in news reports. After that the editors, I assume, do their level best to leave that aspect out of their reporting. Thank you.

  17. Dean D'Amico says:

    Would like to know
    1.How many of the “shooters” can from a broken home…one that there was only one parent.
    2. Where or how was the gun secured?

  18. mike says:

    People are tearing apart the findings b/c they aren’t accurate and only serve an agenda. Without accurate info/stats no solution will ever be reached, time and resources will be wasted going in wrong direction, and more lives will be lost.

  19. Gary says:

    One of the most important factors that is not shown in this data is where and how did the weapon get in their possession? Did the rightful owner of the weapon have it locked or stored properly? Was it a stolen weapon etc. This information would be one of the greatest concerns in better understanding how access to these weapons was so easily obtained and how we can make it more difficult to acquire also increasing the punishment for those who irresponsibly store their weapons for children to get hold of.

  20. […] in 1 child passing away due to its dangerous design. As the Campus Safety Magazine states, “Since 1970, 637 people have died in shootings at schools.” I would think that after 34 victims of gun violence that our country would create stricter gun […]

  21. Jeanette says:

    Yes we have a problem but I agree we need accurate AND complete stats. Were any of these shooters from a “hunting” family? I believe(perhaps wrongly) that children who are taught to respect the power of guns and learn safety measures are less likely to use them for wrong reasons. Please provide backgrounds for these shooters so we can get a better picture of who and where we should be focusing on help.

Leave a Reply

Your email address will not be published. Required fields are marked *

Get Our Newsletters
Campus Safety Conference promo