
This article, originally posted on Dec. 6, 2017, has been updated to reflect current statistics.
While this data is important and may be intimidating, we want to emphasize that active shooter events in schools are still extremely rare. There are many layers to keeping schools secure and students and staff safe. Active shooter response should only be part of your campus safety plan — not all of it.
Although some experts have argued there’s been too much focus on school shootings compared to other campus emergencies, that focus has resulted in a mass collection and analysis of school shooting statistics that provide valuable insights about the nature of the school shooting threat.
These efforts, taken by multiple organizations, have resulted in several valuable reports that provide a comprehensive— if somewhat overwhelming— look at school shooting data of the past. School officials and first responders should familiarize themselves with these statistics even as they maintain an all-hazards approach to emergency planning.
By now, nearly all schools have planned their response to school shootings: In 2020, the CDC found 96% of public schools had a written plan for responding to school shootings, and 98% of those schools had drilled students on a lockdown procedure — up from 90% and 70% in 2016.
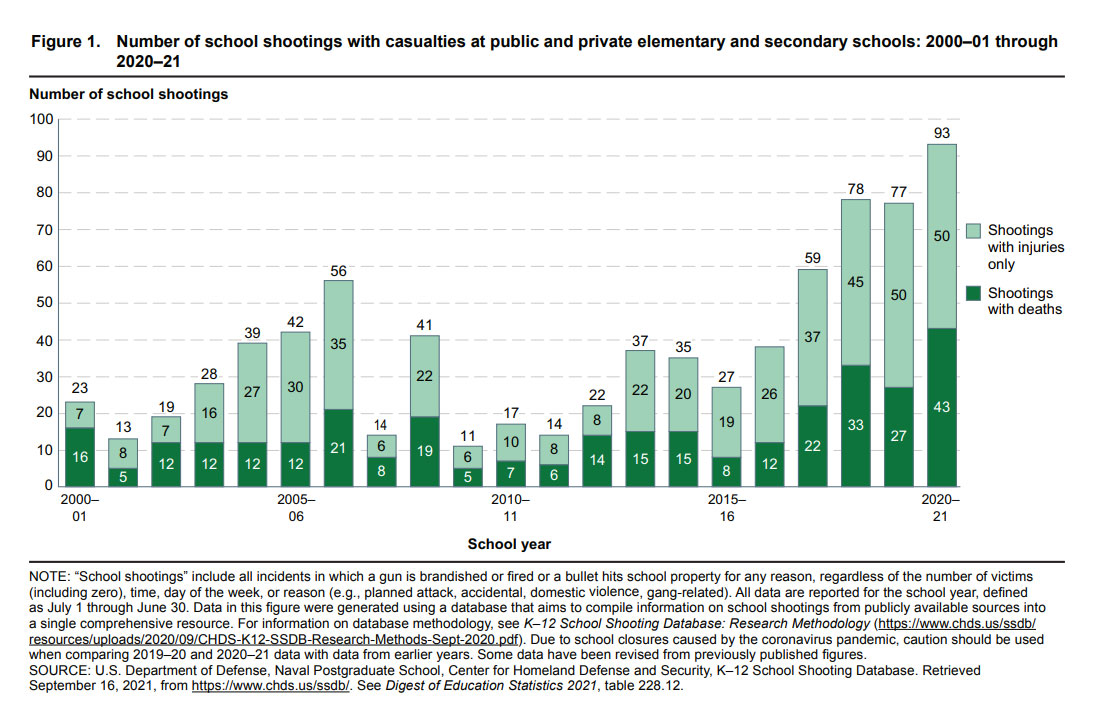
This is for good reason: Shootings are among the most deadly types of emergencies a school may face. According to a government-sponsored report, Indicators of School Crime and Safety: 2021, there were 93 school shootings with casualties at U.S. public and private elementary and secondary schools in 2020-2021 — the highest number in 20 years. Compared to 2000-2001 when there were 23 school shootings, the number recorded in 2020-2021 nearly quadrupled. (See graphic below)
Our goal in providing this in-depth look at school shooting statistics is for readers to understand this threat more completely so they can take a data-driven approach to emergency planning. School shootings are still extremely rare but the latest statistics show our society can’t afford to ignore them.
Putting School Shootings Into Context
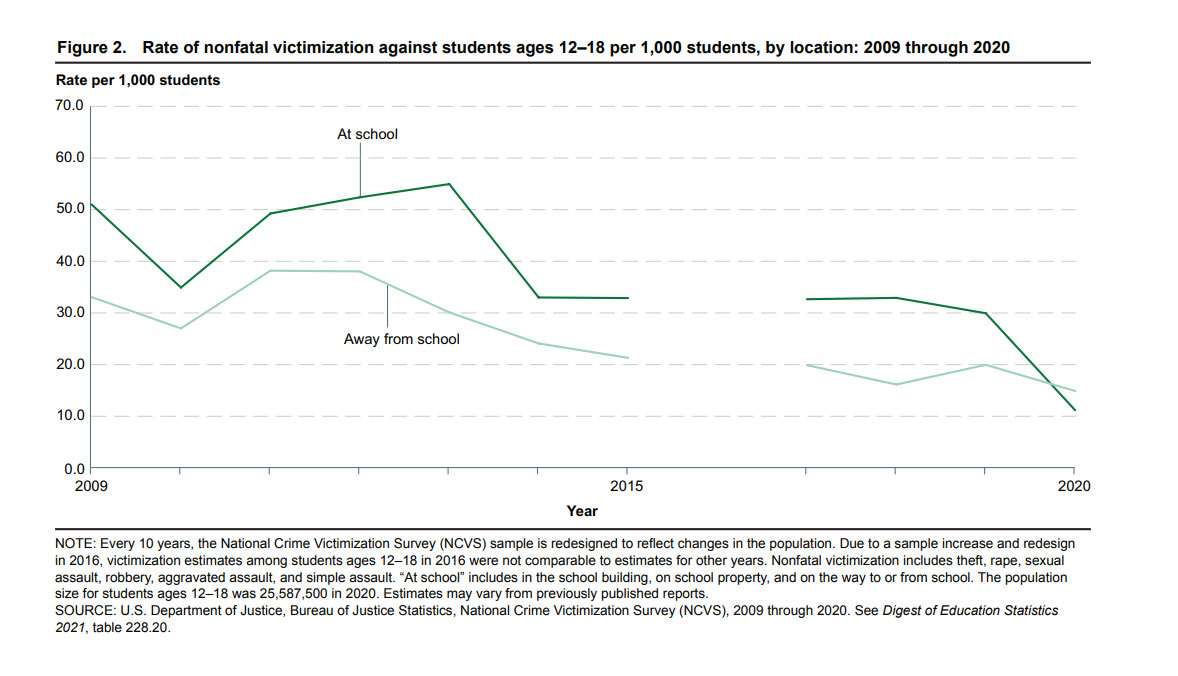
First, let’s compare the prevalence of school shootings to school violence overall. Fortunately, the rate of violent crime in schools dropped significantly from 2009 to 2020. Violent crime experienced by students away from school also dropped. (See graphic below)
However, these statistics do not take all pandemic years into consideration. While completed statistics are still being finalized, a study released by the American Psychological Association (APA) this March found that during the pandemic, rates of violence and aggression against K-12 school personnel were high, despite most schools being remote during the survey. A third of teachers surveyed reported they experienced at least one incident of verbal and/or threatening violence from students during COVID.
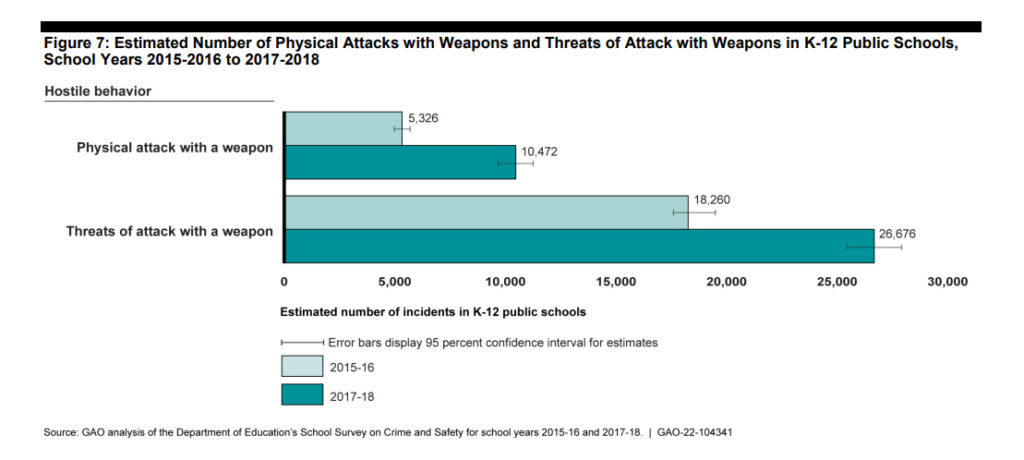
Furthermore, a report from the U.S. Government Accountability Office (GAO) found the number of physical attacks with weapons in K-12 public schools nearly doubled from 5,326 incidents during the 2015-16 school year to 10,472 incidents during the 2017-18 school year. Threats of an attack with a weapon also increased from 18,260 to 26,676. (See graphic below)
Fortunately, the chances a student will be killed at school are far lower than the chances they’ll experience school violence. According to the National Center for Education Statistics, in 2019, 11% of male students and 4% of female students reported having been in a physical fight on school property — meaning the odds of a high school student getting into a fight at school is around one in 7.
Meanwhile, the aforementioned 2021 report counted just 29 homicides of students aged 5-18 that occurred at school from July 1, 2018, through June 30, 2019. As a comparison, K-12 public and private enrollment in 2018 was 57,500,000. James Alan Fox, a criminologist at Northeastern University, says the annual odds that an American child will die in a mass shooting at school are nearly 10 million to one. Furthermore, less than 2% of youth homicides occur on school grounds, on the way to/from school, or at or on the way to/from a school-sponsored event, according to the CDC.
U.S. School Shooting Statistics
Focusing on gun-related school death statistics is necessary to zero in on school shootings. The CDC counted 123 instances of students using guns in school-related homicides or suicides between July of 1992 and June of 1999.
Of these 123 school shootings, here are some statistics on the attackers:
- 93.5% of the shooters were male
- Five students used two firearms each
- 26.8% of the shooters committed suicide
- 69.1% of the shooters perpetrated a homicide
- Of those homicides, 15.6% of shooters killed multiple people
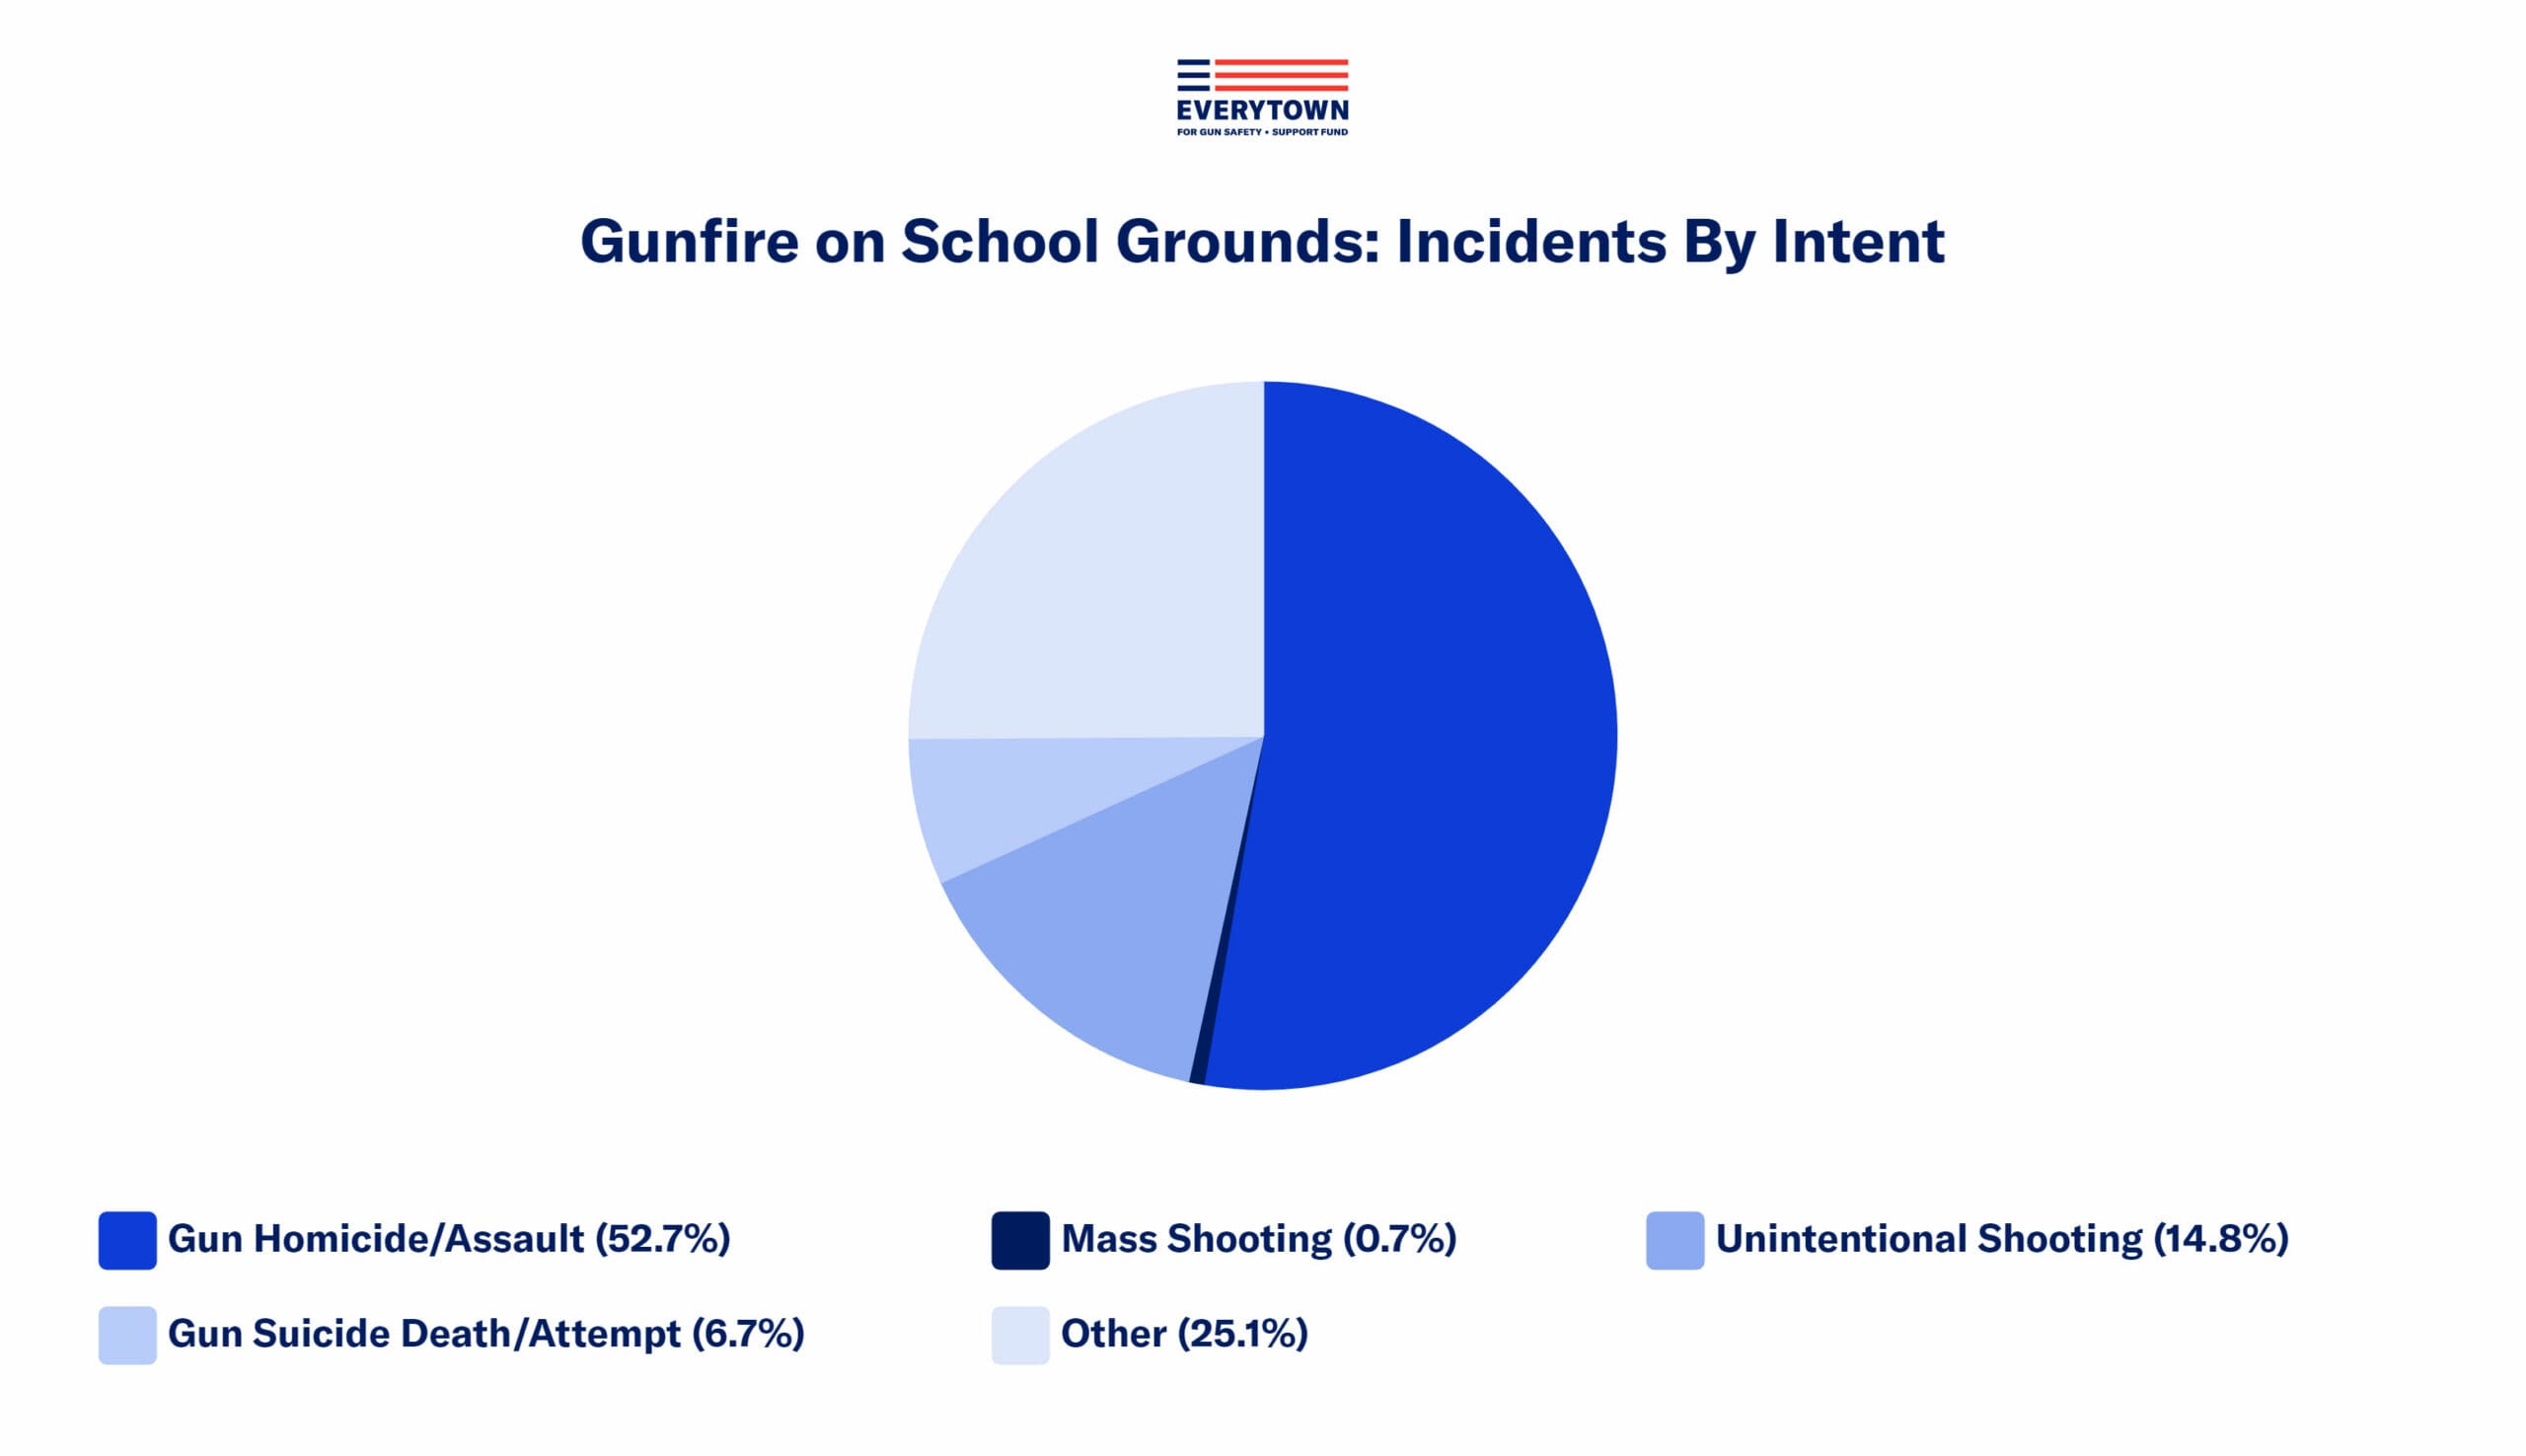
Including non-fatal school shootings make things look more worrisome. Everytown for Gun Safety, a nonprofit organization that advocates for gun control, has tracked at least 1,000 incidents of reported gunfire on K-12 and higher education campuses in America since 2013. As a result, 331 people have died and 698 have been injured. So far in 2022, 50 people have died and 122 have been injured in 152 incidents. The breakdown by intent can be seen in the graph below.
The group’s analysis also gives us the following statistics:
- From 2013 through 2021, there were 848 incidents of gunfire on school grounds
- Between August 1, 2021, and May 31, 2022, there were 193 incidents of gunfire at preschools and K–12 schools
- Between 2013 and 2021, there were 302 incidents of homicides, nonfatal assaults, and attempted assaults with a firearm on school grounds, resulting in 96 deaths and 265 injuries
- There were four mass shootings — incidents where a shooter killed four or more people — in a preschool or K–12 school between 2013 and 2021
- Mass shootings account for 19% of overall gun deaths and 10% of all people shot and wounded in schools
Statistics on Averted School Shootings
Just focusing on school shootings that were actually carried out may miss the full picture. Analyzing data on behaviors that could plausibly lead to school shootings can also give us an idea of the nature of the threat. The U.S. Secret Service’s 2021 report, Averting Targeted School Violence, largely focuses on the behaviors exhibited by students who planned to carry out school shootings.
For the report, researchers studied 67 disrupted targeted school-based violence plots against K-12 schools from 2006 to 2018 to determine best practices for school violence prevention. The researchers defined targeted school-based violence as “(i) a current or recently former K-12 school student (ii) took steps to advance an attack plan (iii) to cause physical injury to, or the death of, at least one student and/or school employee.”
In the report, the Secret Service said there is no “profile” of a school shooter, finding that attackers varied considerably in demographics, background, and other characteristics. Still, they offered several notable insights, including the fact that students who plotted school attacks shared many similarities with students who carried out attacks. The report emphasized that this piece of information shows that targeted school violence is preventable when communities identify warning signs and intervene as necessary.
Below are some of the report’s other important findings regarding the plotters: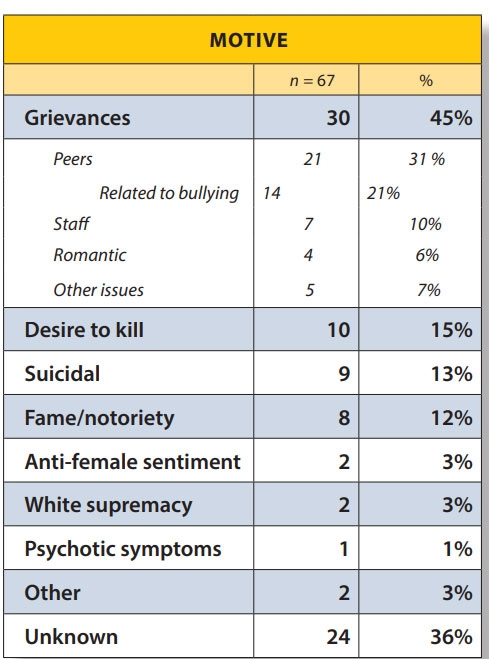
- 95% were males
- Plotters ranged in age from 11 to 19, with an average age of 16
- 95% were current students and 5% were recently former students who had attended the targeted school, or a school from the same district, within one academic year of the plot
- Plotters ranged from 6th to 12th grade with the majority in grades 9-12
- Plotters usually had multiple motives, the most common involving grievances with peers or staff (45%) (See graph for additional motives)
- 85% engaged in planning related to weapons
- 73% detailed how they would execute their attacks
- 57% documented some of their thoughts and intentions regarding their planned attacks
- 31% conducted research into prior attacks as part of their planning
- 16% attempted to recruit others to carry out their attacks
- 55% chose to use at least two or three types of weapons
- 96% of the weapon(s) of choice included one or more firearms
- 94%shared their intentions about carrying out an attack
- 37% received some form of school discipline prior to the discovery of their plots
- 30% had contact with law enforcement prior to the discovery of their plots
- 70% exhibited behaviors indicating the presence of some type of mental health symptom in the time
leading up to, or around, the discovery of their plots - 63% exhibited emotional or psychological symptoms
- 33% had a history of substance use and/or abuse
- 91% experienced life stressors in the five years prior to their averted attack
- 67% had an interest in violence
Additional “Red Flag” Behaviors
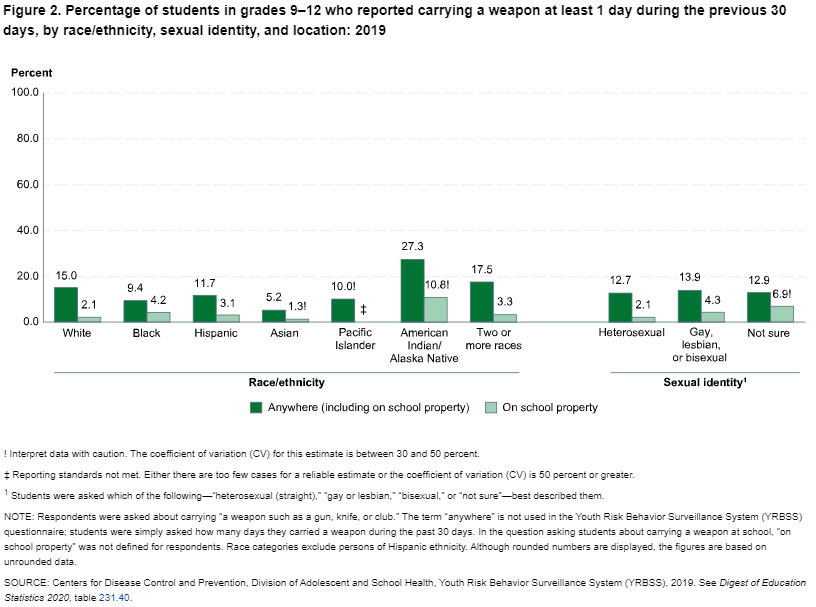
Another potential red flag behavior is bringing a weapon onto school property. Fortunately, the data here is encouraging: A 2021 report by the National Center for Education Statistics found that between 2009 and 2019, the percentage of high school students who reported carrying a weapon onto school grounds in the last 30 days decreased from 6% to 3%. Below is a breakdown by location, race/ethnicity, and sexual identity of students who reported bringing a weapon to school in 2019.
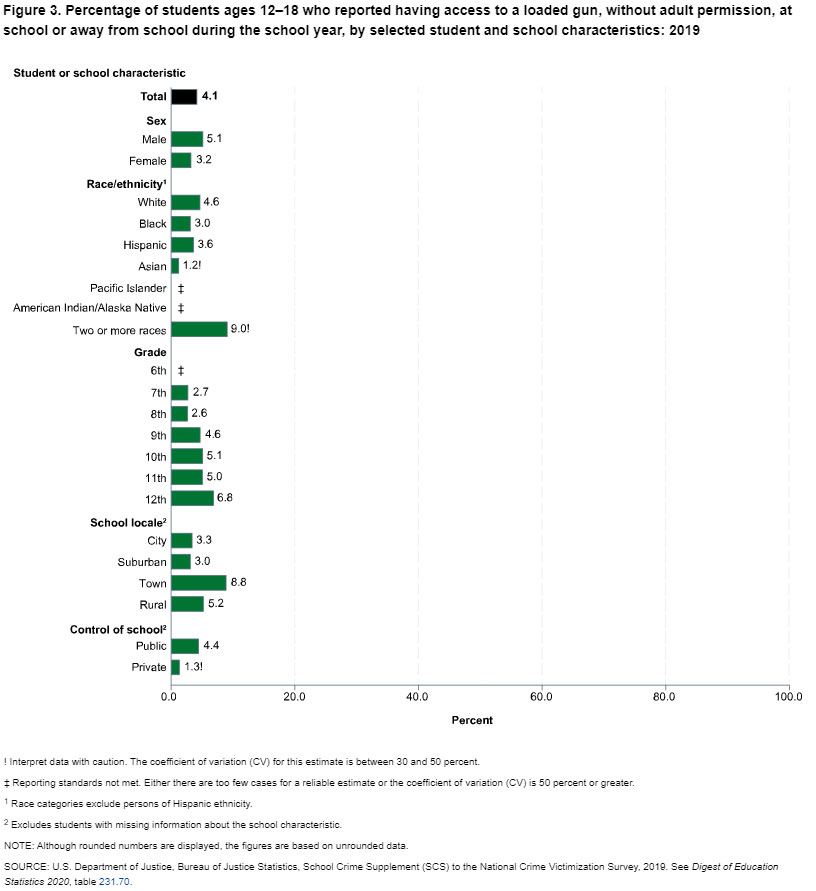
Another red flag is students who report having access to loaded guns. The Secret Service’s 2021 report found 70% of school shooting plotters had access to a family member’s firearm in their home with 63% having unimpeded access.
The National Center for Education Statistics’ 2016 study also offers insights. The data, which depicts students who have access to a loaded gun without adult permission, shows minimal variation when broken down by more recent school years. See the breakdown below.
Putting These Statistics to Use
It’s our hope that these reports and the school shooting statistics within them are used by officials to make more informed decisions when crafting emergency plans. But school officials aren’t the only ones who can use these statistics to help prevent shootings. A look at where attackers got their weapons reveals the role gun safety plays in the equation.
We’ve published content by experts on spotting concealed weapons and active shooter prevention strategies, all with the belief that a smarter society is a safer society. Staying informed about school shooting statistics is the first step toward preventing these horrible attacks.
Do you have a Threat Assessment Checklist? If not, you’ll want to download this free Active Shooter Checklist now!