Bullying, commonly defined as unwanted and aggressive repetitive behavior that involves a real or perceived power imbalance, has essentially existed since the beginning of time. However, with so many more outlets of communication available at our fingertips, recent studies show bullying in K-12 schools has taken on a life of its own.
Before we delve into specific bullying statistics, it is important to define the different types of bullying that exist today.
It’s likely that when many of us think of bullying “back in the day,” we largely recall name-calling or shoving as the most common forms. Due to several influences like technology and social media, bullying has expanded to include four main categories:
- Verbal bullying, including teasing, inappropriate comments, name-calling, threats and offensive hand gestures.
- Social bullying, including intentional exclusion, spreading rumors and embarrassing someone.
- Physical bullying, including hitting, kicking, spitting, pushing or breaking someone’s personal belongings.
- Cyberbullying, which includes many of the same behaviors as social and verbal bullying, but takes place online where information can be quickly disseminated and to a large number of people.
General Bullying Statistics
Here are some overall bullying statistics from a study released by The National Center for Education Statistics in December 2016. The authors surveyed students ages 12-18 during the 2014-2015 school year.
- One in five (20%) students reported being bullied (down from 23% in 2005).
- 66.8 % said they were bullied once or twice in the school year; 33% were bullied at least once or twice a month during the school year; 4.2% were bullied almost every day.
- 13.3% were made fun of, called names or insulted; 12.2% were the subject of rumors; 3.9% were threatened with harm; 5.1% were pushed, shoved, tripped, or spit on; 2.5% were tried to make do things they didn’t want to do; 5% were excluded from activities on purpose; 1.8% had their property destroyed on purpose.
- 33.6% of bullying occurred in a classroom; 41.7% occurred in a hallway or stairwell; 9.4% occurred in a bathroom or locker room; 22.2% occurred in the cafeteria; 19.3% occurred outside on school grounds; 10% occurred on the school bus; 11.5% occurred online or by text.
- 22.8% of females reported being bullied compared to 18.8% of males.
To see more in-depth data on types of bullying, the location of bullying and the frequency of bullying, including by race, grade and household income, view this article’s slideshow.
Cyberbullying Statistics
Along with the rising use of technology and social media comes the continued threat of cyberbullying.
While recent data from the Centers for Disease Control suggests cyberbullying (or “electronic” bullying, as the study refers to it) has been on a slight decline from 2015 to 2017, it still poses a significant threat to adolescents and teens.
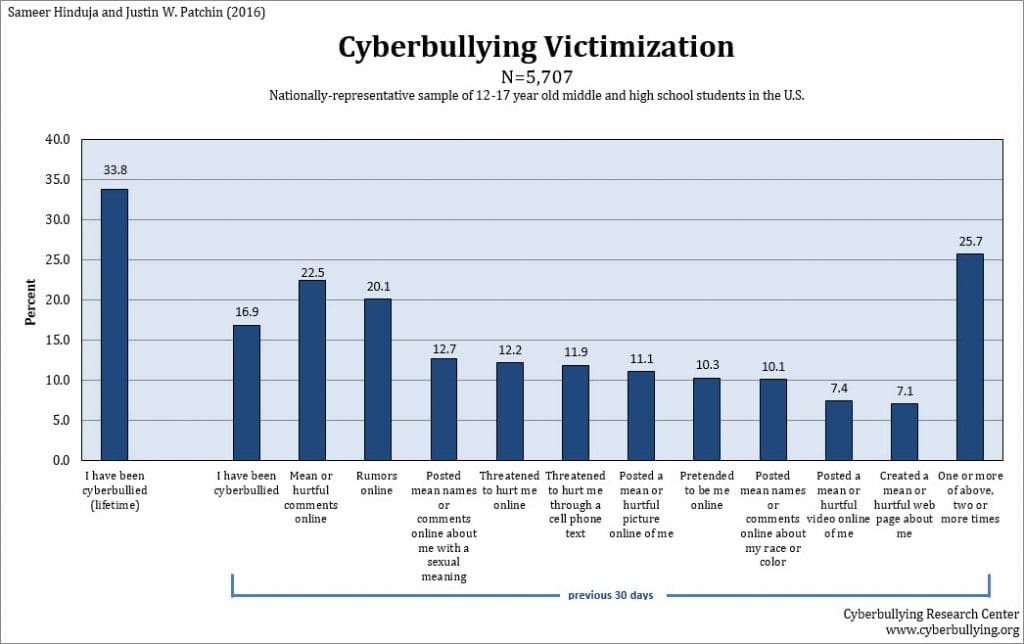
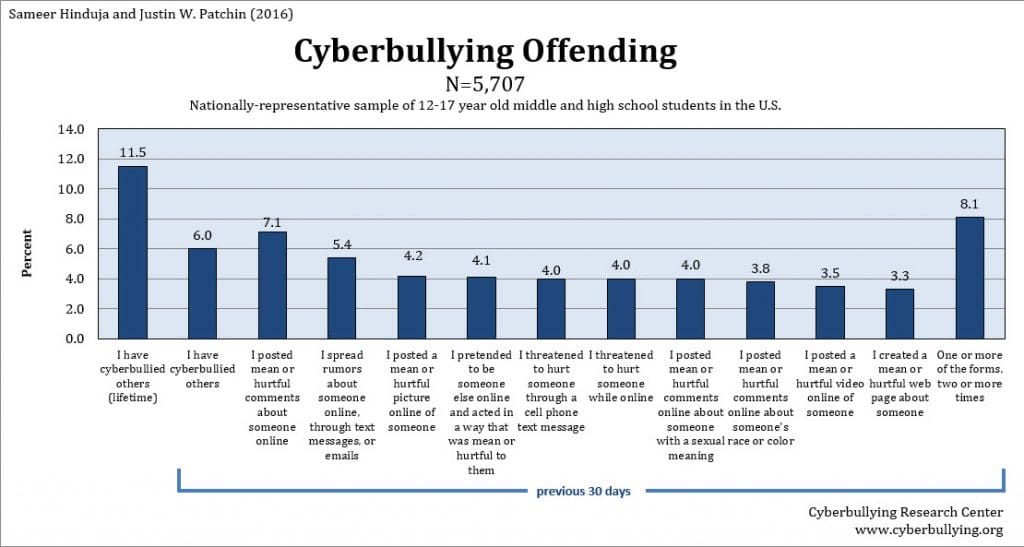
A 2016 study conducted by Dr. Justin Patchin and Dr. Sameer Hinduja surveyed a nationally-representative sample of 5,700 middle and high school students ages 12-17 from July through October. The results showed that the percentage of students who have experienced cyberbullying at some point in their lifetime has nearly doubled from 18% in 2007 to almost 34% in 2016.
The researchers asked students what kind of bullying they had endured and what kind of bullying they had done to someone else in the previous 30 days. Below are two charts of those findings.


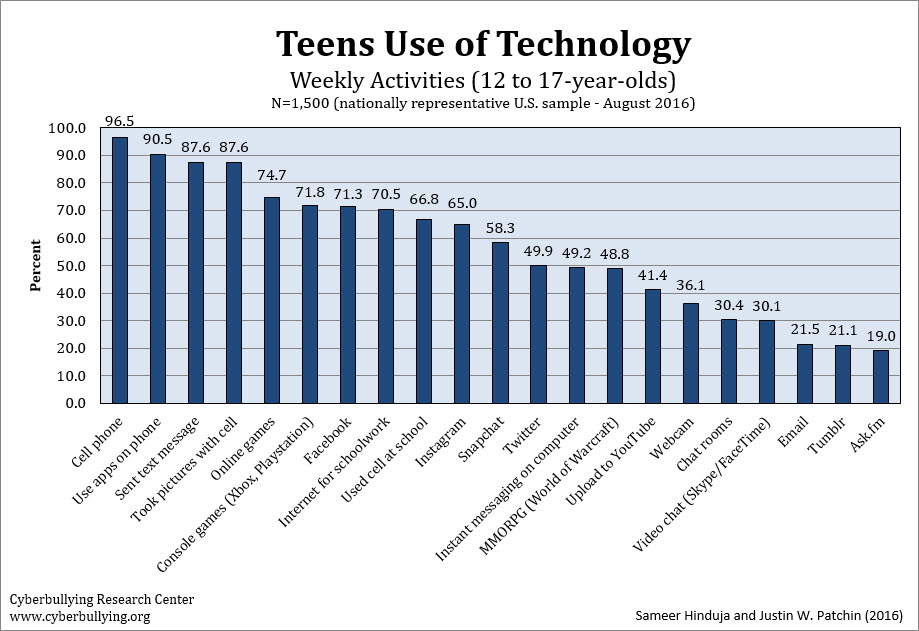
The researchers also collected data on the students’ weekly use of technology to get a representation of its prevalence in their lives and the different potential outlets for bullying. Below is a chart of the study’s findings.

The popularity of cell phones and other technologies allow students to use social media both in school and at home, making cyberbullying an around-the-clock occurrence. Because of this, both parents and teachers can play an integral role in effectively addressing online safety issues.
Clay Cranford, the deputy sheriff for the Orange County (Calif.) Sheriff’s Department, who is an expert on cybersecurity for children, spoke with us at the 2016 Campus Safety Conference about how parents and teachers can help students stay safe online. Check out the video here.
Bullying Statistics Surrounding Minority Groups
People of all ages who are part of a minority group have long been singled out for their differences, making students who are part of a minority group more prone to bullying.
The National Center for Educational Statistics’ 2016 study we mentioned earlier found the most common reasons students reported being bullied are because of physical appearance, race and ethnicity, gender, disability, religion or sexual orientation.
Continue on to the next page to learn more about bullying of students with disabilities and those who identify as part of the LGBTQ community.


