
This past November, a report released by the FBI found hate crimes in the U.S. have spiked for the third year in a row, increasing 17% from 2016 to 2017 alone.
We wanted to take a deeper dive into these statistics to see who is being targeted and what types of crimes are being committed, particularly because several recent reports also show an uptick in hate crimes on school or college campuses.
In 2017, the U.S. Department of Education reported 1,143 hate crimes based on 6,339 institutions with 11,210 campuses. In March 2019, the Anti-Defamation League (ADL) released a report that found white supremacy propaganda has increased on college campuses. In 2018, the ADL recorded 319 incidents on 212 college and university campuses.
Students have also been speaking out about racism and hate speech on their campuses. At Boise State, students reported the “n-word” being written on dorm room doors across campus, along with swastikas and death threats against non-white students. In Los Angeles, two Armenian private schools were vandalized with Turkish flags.

The two federal organizations that are the principal sources of annual information on hate crimes in the United States are the FBI and the Bureau of Justice Statistics (BJS). The FBI gathers data through its Uniform Crime Reporting (UCR) Program and the BJS gathers its data through its National Crime Victimization Survey (NCVS). We’ll take a look at both.
The UCR Program collects data regarding criminal offenses that were motivated, in whole or in part, by the offender’s bias against the victim’s race/ethnicity/ancestry, gender, gender identity, religion, disability, or sexual orientation, and were committed against persons, property, or society, according to its site.
The report only includes data based on law enforcement agency reports and classification. The statistics also include hate crimes against organizations, businesses, institutions, schools and religious facilities. Here’s more info on the methodology.
In each year’s report, the FBI breaks down hate crime statistics into five specific categories:
- Incidents and offenses by bias motivation
- Victims
- Offenders
- Location type
- Hate crime by jurisdiction
Before we jump into specific 2017 hate crime statistics, below is a chart created by Politifact, showing the increase in hate crimes by incident type from 2012 through 2017:
A survey conducted by Kevin Grisham and Brian Levin of the Center for the Study of Hate & Extremism-California State University, San Bernardino, found similar results in 30 major U.S. cities from 2010-2018, shown in the chart below:
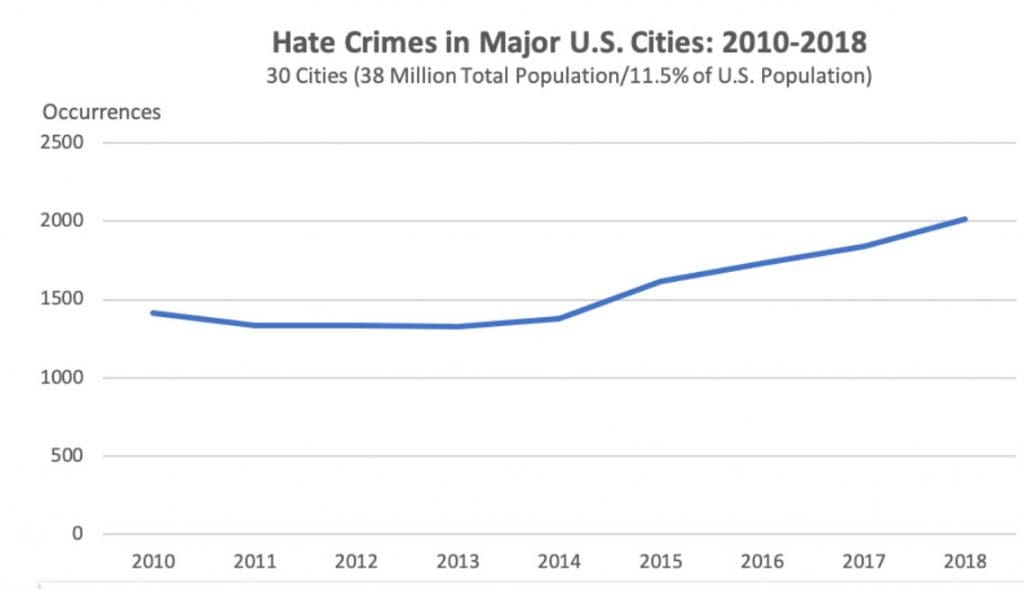
According to Levin, 70% of cities reported an increase in hate crimes from 2017 to 2018 and just under half hit a decade high. Cities that recorded decade-high hate crimes include Austin, Chicago, Cleveland, Dallas, Fort Worth, Houston, Los Angeles, Louisville, Miami, New Orleans, Philadelphia, Sacramento, San Francisco, Seattle and Washington, D.C. However, Levin also notes that some of the increase is the result of more rigorous reporting.
Alfred Blumstein, a professor at Carnegie Mellon University, said with the increasing national attention and the current political climate, people may be more ready to report hate crimes to the police and are also better equipped to decide if an incident is a hate crime.
Additionally, the Center for the Study of Hate & Extremism found “hate crimes have increased in every presidential election year since national FBI recordkeeping began in the early 1990s.” The spike in 2016 corresponded with the November election month.
The FBI’s 2017 Hate Crime Statistics
Results gathered for the FBI’s 2017 report included data from 16,149 law enforcement agencies and covered a population of 306,435,676.
Of these agencies:
- 2,040 reported 7,175 hate crime incidents involving 8,437 offenses
- There were 7,106 single-bias incidents that involved 8,126 offenses, 8,493 victims and 6,307 known offenders
- There were 69 multi-bias incidents reported that involved 311 offenses, 335 victims and 63 known offenders
Of the 8,126 single-bias hate crime offenses:
- 59.5% stemmed from a race/ethnicity/ancestry bias
- 20.7% were motivated by religious bias
- 16% resulted from sexual-orientation bias
- 1.6% resulted from bias against disabilities
- 1.6% stemmed from gender-identity bias
- 0.7% were prompted by gender bias
See Table 1 for further breakdown and see Table 7 for more data on victims of hate crimes.
Here’s the breakdown by offense types:
- 27.6% were destruction/damage/vandalism
- 27.1% were intimidation
- 20.7% were simple assault
- 11.7% were aggravated assault
See Table 2 for further breakdown.
Here’s a breakdown by crime category:
- 60.3% were crimes against persons
- Of the crimes against persons, 44.9% were intimidation, 34.3% were simple assault, 19.5% were aggravated assault, 0.7% consisted of 15 murders and 23 rapes
- 36.9% were crimes against property
- Of the crimes against property, 74.6% were acts of destruction/damage/vandalism and 25.4% consisted of robbery, burglary, larceny-theft, motor vehicle theft, arson and other crimes.
- The remaining offenses were crimes against society
- There were 238 offenses against society — i.e. drug or narcotic offenses or prostitution
See Table 2 for further breakdown.
If you’re interested in knowing where your state or city/town falls regarding hate crime statistics, view Table 14 here.
Read on for findings from the Bureau of Justice Statistics’ National Crime Victimization Survey.


