The 2024-2025 academic year is in full swing, and many K-12 school districts are more focused than ever on student safety and campus security. However, an often overlooked part of school safety is buses.
While school buses remain one of the safest modes of transportation for students, it is estimated that 108 people are killed and 13,200 are injured in school bus accidents each year.
According to data collected from the National Highway Traffic Safety Administration (NHTSA), between 2013 and 2022, school bus crashes resulted in approximately 132,000 injuries. There were also 976 fatal school bus accidents resulting in 1,082 deaths.
School Bus Crashes by State
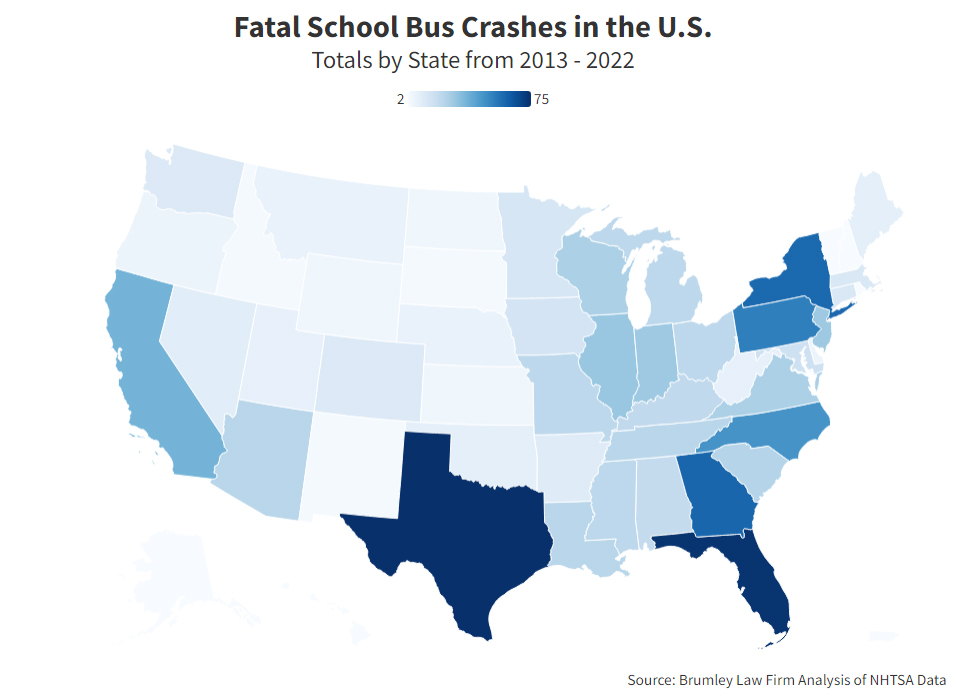
An analysis by Brumley Law Firm breaks down the findings by state. The 10 states with the most crashes and fatalities, respectively, are:
- Texas (75 and 87)
- Florida (74 and 76)
- Georgia (60 and 65)
- New York (59 and 59)
- Pennsylvania (53 and 59)
- North Carolina (47 and 52)
- California (37 and 39)
- Illinois (30 and 34)
- New Jersey (29 and 32)
- Indiana (29 and 33)
The 10 states with the fewest school bus crashes and fatalities are:
- Vermont (2 and 2)
- New Hampshire (2 and 2)
- Hawaii (2 and 2)
- South Dakota (3 and 4)
- New Mexico (3 and 3)
- Idaho (3 and 3)
- North Dakota (5 and 6)
- Wyoming (5 and 5)
- Kansas (5 and 5)
- Oregon (6 and 6)
The full list can be found here and Brumley Law Firm’s heatmap can be found below.

RELATED ARTICLE: Enhancing School Bus Safety with AI: Protecting Students on the Road and Beyond
Brumley Law Firm also looked at which roads had the most fatal school bus crashes, determining only seven roads experienced more than one fatal school bus crash. Two of those seven roads are in Florida (US-301 and CR-611) while the others are in Texas (I-20), Pennsylvania (SR-113 Uwchlan Ave), California (SR-165), North Carolina (US-311), and Louisiana (US-61).
(*Population, as well as other factors, should be taken into account when reviewing these statistics. For example, the two U.S. counties with the most fatal school bus crashes were Harris County, Texas, and Kings County, N.Y. — both of which are some of the most populous counties in the country, according to Brumley Law Firm.)
School Bus Crashes by Time of Day
NHTSA’s analysis also looks at what time of day a school bus fatality is most likely to occur. Not surprisingly, school bus fatalities are most likely to happen during the early morning and mid-afternoon hours as those are the most common times students are being transported to and from school.
More specifically, most school-aged fatalities occur between 3:00 p.m. and 3:59 p.m. (26%) and 7:00 a.m. and 7:59 a.m. (19%).
Positive Trend in School Bus Crashes
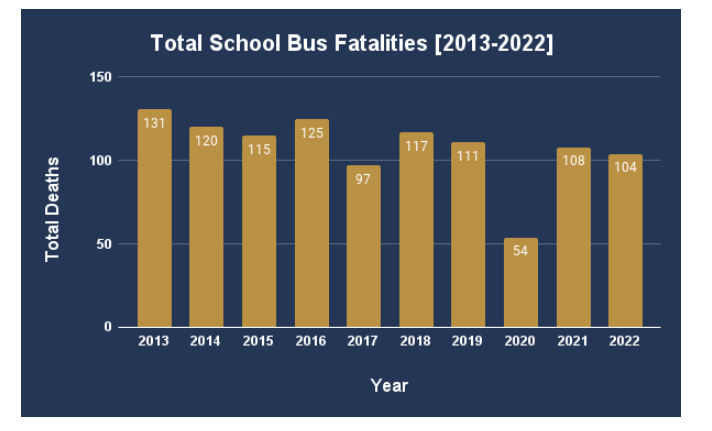
Thankfully, there has been a positive decline in overall school bus deaths since 2013, largely thanks to technological advancements and improved safety measures. According to the NHSTA, students are 70 times more likely to get to school safely when taking a bus instead of traveling by car. While there were 343,391 fatal motor vehicle crashes that occurred between 2013 and 2022, only 0.28% involved school buses.
Total school bus injuries have also decreased by nearly 50%. In 2013, there were 24,000 total injuries compared to 12,500 in 2022.

Source: Brumley Law Firm Analysis of NHTSA Data
RELATED ARTICLE: 3 Simple Things School Bus Drivers Can Do to Improve Student Safety
While school bus crashes, injuries, and deaths are trending downward, we must also consider the other passengers involved in crashes. Occupants of other vehicles are most likely to die in a school bus accident. For example, in 2022, 76 occupants of other vehicles were killed in school bus crashes compared to 12 school bus occupants, 13 pedestrians, and three bicycle, skateboard, scooter, or wheelchair users.
Overall, occupants of other vehicles made up 71% of all school-bus related deaths from 2013 to 2022. NHTSA also found there were 1.5 times more fatalities among pedestrians (169) than occupants of school transportation vehicles (111) in crashes from 2013 to 2022.
School Bus Seat Belt Requirements
Whether or not seat belts on school buses has contributed to the overall decrease in injuries or fatalities is up for debate. Federal law mandates that school buses under 10,000 pounds have lap and shoulder belts for all seats. Those over 10,000 pounds are only required to have seat belts for the driver.
Only nine states in the U.S. currently have seat belt laws for school buses, and those laws somewhat vary. For instance, some only require school buses manufactured after a certain date to have seat balls. Others depend on how many passengers the bus has.
The states with seat belts laws are:
- Arkansas
- California
- Florida
- Iowa
- Louisiana
- Nevada
- New Jersey
- New York
- Texas
On the contrary, some experts say seat belts in school buses won’t necessarily make students more safe. According to NHTSA, large school buses distribute crash forces differently than other vehicles and passengers experience much less crash force than those in passenger cars, light trucks, and vans.
“There is no question that seat belts play an important role in keeping passengers safe in these vehicles but school buses are different by design, including a different kind of safety restraint system that works extremely well,” the NHTSA explains.
School buses are designed using “compartmentalization,” meaning children are protected from crashes by strong, closely-spaced seats that have energy-absorbing seat backs.
States with School Bus Stop-Arm Camera Laws
Many school bus injuries or fatalities have been caused by vehicles illegally passing a bus. Stop-arm cameras installed on the exterior of buses have helped law enforcement identify drivers who illegally pass school buses, acting as a deterrent for other drivers.
RELATED ARTICLE: Georgia: 8-Year-Old Hit, Killed While Getting on School Bus
Some school districts have used grant funding to retrofit their fleets. For instance, in Sept. 2023, Eden Prairie Schools in Minnesota used a $53,000 grant from the Minnesota Department of Public Safety to equip all buses with stop-arm cameras.
Currently, only 25 states have enacted school bus stop-arm camera laws, including:
- Alabama
- Arkansas
- Connecticut
- Delaware
- Florida
- Georgia
- Idaho
- Illinois
- Indiana
- Maine
- Maryland
- Michigan
- Mississippi
- New York
- North Carolina
- Oklahoma
- Pennsylvania
- Rhode Island
- South Carolina
- Tennessee
- Utah
- Virginia
- Washington
- West Virginia
- Wyoming
Video surveillance cameras should also be inside school buses. It enforces safe driving practices since the footage can be reviewed following a crash. It has also proven helpful in reviewing medical emergencies, bullying, and acts of violence, among other things.
Involving School Bus Drivers in Campus Trainings
It is a recommended practice that schools regularly conduct scenario-based training exercises with various stakeholders, including school bus drivers. These exercises, commonly referred to as tabletop exercises, present participants with real-life scenarios and help strengthen school emergency plans.
RELATED ARTICLE: 1 Student Killed, 22 Others Injured in Ohio School Bus Crash
Thorough Background Checks
Schools and districts must also conduct thorough background checks on all potential school bus drivers. During a time where many districts are experiencing bus driver shortages, districts cannot loosen these requirements.
According to Backgroundchecks.com, every school bus driver background check should include:
- Driving history records
- Employment verifications: Studies show that 30-40% of all job applicants put false information on their resumes or applications and exaggerate their qualifications during interviews
- Criminal history checks: Some states, like Massachusetts, make school bus drivers get fingerprinted)
- Social Security Number trace: This can reveal past names, aliases, and addresses associated with a candidate)
- Drug screening
For more information about school bus safety best practices and data, visit nhtsa.gov.


