During the past 30 years, the law enforcement community has experienced tremendous growth in capturing crime data, as well as calls for service. Many creative partnerships have emerged among local police agencies, local universities and software vendors. These collaborations have produced robust applications that assist police agencies in understanding crime. Agencies that follow the Computer Statistics (COMPSTAT) model — holding commanders accountable for crime committed within their assigned patrol areas — understand the need for receiving timely intelligence used to develop strategies that address crime.
One core tool employed by many successful law enforcement agencies to identify crime problems, guide operational deployment to address the problems, and assess overall impact in reducing crime is computerized crime analysis and mapping software.
The University of Pennsylvania’s (UPenn) Division of Public Safety (DPS) — accredited by the Commission on Accreditation for Law Enforcement Agencies (CALEA) since 2001 — is taking this proactive and organized approach to policing. The process of integrating crime analysis and mapping in an entirely new way helps to identify crime patterns that transcend campus boundaries, enabling DPS’ efforts to forge collaborative partnerships with other law enforcement agencies and adjacent communities.
UPenn Officials Knew They Needed a Change
Many law enforcement agencies have used crime analysis and mapping in the past to assess the overall impact of crime in a community. In 1997, the city of Philadelphia Police Department (PPD) embarked on an experiment to prove the value of a professional crime analysis and mapping unit. The mission of this unit was to provide timely information for patrol commanders as part of the COMPSTAT policing model implemented by PPD Commissioner John Timoney. The experiment proved to be highly successful, culminating with the implementation and rapid adoption of a decentralized, citywide crime analysis and mapping system available in every PPD office through the city’s secure intranet.

For a number of years, UPenn had been developing a strong partnership with PPD. Because of the school’s location, DPS recognized the need to understand the relationship of crime in adjacent communities, as well as how crime strategies collaboratively implemented by PPD and DPS would impact crime in West Philadelphia.
In 2002, under the direction of Vice President for Public Safety Maureen Rush, DPS began developing crime prevention strategies that extended into the surrounding communities, with a goal of enhancing community growth and development. Historically, DPS, like most law enforcement agencies, restricted its interests to highly defined police service areas for patrol purposes. This greatly hampered the coordination between administrative, patrol and investigative units. With the adoption of new crime prevention strategies, police, security partners, dispatchers and community members became aware of complex crime patterns that occured not only within the boundaries of the university but also in nearby communities.
Also in 2002, knowing that PPD had created a central system that captures all reported crime in Philadelphia, Rush sought and was granted approval from Deputy Police Commissioner Charles Brennan to receive daily downloads of all crime reported to PPD that occurred within the immediate patrol area of DPS. This complex urban patrol area consists of 269 acres and 155 buildings, primarily in West Philadelphia. In all, this process was inherently limited, due to the large volume of crime data now being handled by DPS in data tables, without an easy method to visualize patterns.
During this initiative, DPS also designated an existing staff person to focus on crime analysis and began to use an off-the-shelf mapping software application to analyze incoming crime data. This proved to be a very labor-intensive process, prone to data input errors, and only captured crime within certain patrol zones derived by PPD. DPS officials realized they needed an enhanced mapping system that could quickly and efficiently analyze and map crime patterns and hot spots; help users develop more informed crime-fighting strategies and tactics; and enable commanders to more effectively manage the deployment of law enforcement resources and personnel.
Due Diligence Determined New System’s Requirements
Prior to considering a technology upgrade, DPS administrators conducted a needs assessment based on current strategies to analyze crime patterns. In addition, it created a small working group consisting of police officers, detectives, supervisors, commanders and other stakeholders who indicated their specific needs and suggested real-life scenarios that had to be supported by the new technology. DPS personnel also spoke with other urban universities that employed crime analysis and mapping strategies.
These discussions helped DPS determine exactly what was required to implement successful law enforcement strategies. The department had difficulty with a rash of thefts from autos. They suspected a relationship between this activity and the existence of group homes or halfway houses. The new technology would need to allow the user to view and plot thefts from autos on a map in relation to nearby group homes so detectives and officers could begin to ask questions that were never considered before, such as: Is it possible a member of the group home is breaking into the autos in the neighborhood? Who lives in the group home? Has anyone with a past record of similar activity recently been released from prison and now lives in the area? What individuals are on probation or parole with a prior record for breaking into autos?
Amassing scenarios like this helped document requirements that went beyond simple pin-mapping and helped identify new data acquisition and integration goals for the project.
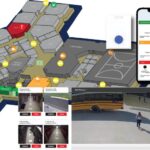
Armed with this important information, DPS solicited proposals from crime analysis software vendors while they created an official crime analysis and mapping unit. After reviewing available offerings, UPenn selected the GeoDecisions Crime Analysis and Mapping System® (GeoCAMS®), a flexible application that enables law enforcement personnel to search and analyze multiple sources of incident and intelligence data and then map the results.
“The staff at GeoDecisions have prior experience with PPD, as well as direct, career-long experience in law enforcement,” notes Rush. “The GeoCAMS product is very intuitive and simple-to-use, so even line officers can become proficient, freeing up our crime analysis and mapping unit for more in-depth analysis.”
In addition to data integration and reporting modules, GeoCAMS consists of two toolsets. The first set includes automated tools for querying an incident and/or intelligence database then analyzing the resulting data supporting the mission of administration, patrol and investigation. The second set provides the user with graphic tools to place different kinds of symbols on the map for creating tactical deployment plans, supporting the mission of patrol and emergency management.
Updates Continue to Address UPenn’s Evolving Needs
Since its first installation, GeoCAMS has been enhanced and updated to meet the changing needs and requirements of DPS. These enhancements have enabled DPS to continually look for ways to improve the application, keeping the safety of the community at the forefront.
The first implementation of GeoCAMS provided access to daily downloads of crime from PPD; allowed DPS staff to query and display crime maps by shifts instead of displaying all crime (making it easier for officers to narrow in on certain crime incidents); produced automated map series; and helped introduce the value of understanding geospatial layers.
DPS contracted with GeoDecisions to develop many of the critical supporting map layers still in use today, including the location of al
l bike racks, Southeastern Pennsylvania Transportation Authority (SEPTA) bus/subway stops, security cameras, hospitals, schools, parks, group homes, halfway houses, DPS police beats, rivers and PPD police districts/sectors. The early implementation also automated the analysis of crimes by day of week and time of day by producing interactive charts. The application’s COMPSTAT report, location history analysis, buffer analysis and hot spot analysis tools were customized for DPS users. This information was previously analyzed using basic spreadsheets.
For the next round of enhancements, DPS again contracted with GeoDecisions and its data integration partner, Avencia Inc., to expand the geographic coverage area to include adjacent neighborhoods that could impact crime on campus. Once again, the relationships forged between PPD and UPenn proved to be significant. The city agreed to export data on all arrested subjects to DPS on a daily basis.
In addition to plotting all reported crime according to Uniform Crime Reports (UCR) classification, calls for service from DPS’ computer aided dispatch system were exported to GeoCAMS for analysis. Arrest information also began to be imported from PPD’s Preliminary Arrest and Arraignment System (PARS) and was made available to users. This feature enabled GeoCAMS users to view information related to arrested subjects and reported crimes.
With these capabilities, DPS has the ability to distinguish between reported crimes that have or have not resulted in an arrest. Armed with this information, DPS can view points on a map that indicate when an incident occurred, if a subject was arrested, and the identity and residence of a subject. They can further graphically connect the residence of the arrested subject to the location of the incident by a red line through the use of the link analysis tool provided by the system.
System Keeps Supervisors, Officers, Investigators Accountable
Using geographic information systems (GIS), GeoCAMS helps DPS democratize analysis and mapping capabilities beyond its highly skilled crime analysts and throughout its law enforcement organization. Fitting a geo-accountability model in this way, their patrol supervisors and officers are held accountable for crime levels in their primary patrol service areas. In addition, investigators are held accountable for the number of cleared cases.
“Specifically, we use GeoCAMS to look at crime trends,” says John Urban, a crime analyst with DPS. “With this application, patrol officers and detectives can use it themselves to develop strategies to prevent and solve crimes. They don’t need help from a special unit or trained analyst. It’s very user-friendly.”
DPS officers are in charge of monitoring crime in different areas of the campus. By mapping crimes, such as stolen bicycles or noise violations, GeoCAMS enables personnel to recognize crime trends and patterns. The successful deployment of these enhancements served to fuel new requirements for data integration and functionality.
According to Urban, the most recent round of enhancements to GeoCAMS has proved to be the most beneficial. A more customized buffer zone analysis process was automated allowing a user to quickly capture and view all reported crime within a set proximity of a specific location. For example, a detective can view automobile thefts that occurred within 100 feet of a single parking garage of interest or all parking garages. This, in turn, can be related back to patrol to help coordinate the redeployment of resources. To keep pace with UPenn’s physical growth, the map data available in GeoCAMS was updated with recently constructed buildings and infrastructure features related to the campus security system.
With the ongoing assistance of PPD, the DPS crime analysis and mapping unit is able to use GeoCAMS to pull and analyze prisoner release and active warrant data throughout West Philadelphia for crime analysis purposes. For example, after a user conducts a routine query and analysis and produces an output map, he or she can display existing warrants as a new map layer differentiated by a unique map symbol. The user is then able to review the details of active warrants for the arrest of individuals who are believed to live in close proximity to an incident location.
With this information, DPS can effectively visualize questions related to incidents by determining a suspect’s “hunting area.” The analysis may also help determine a defendant’s probable method of transportation. With daily downloads of updated prisoner release data, DPS analyzes the distribution of particular crime events versus the last known address of recently released prisoners who were convicted of that same type of crime.
As an example, users can display a series of robberies that occurred within a two-month period, add a layer that displays the location of existing warrants for robbery, as well as the location of released prisoners who served time for robbery. This information is extremely valuable to investigators in narrowing down a field of potential perpetrators.
3D Aerial Photography May Soon Be Incorporated
Today, DPS commanders develop new strategies on a daily basis from the timely information gathered from GeoCAMS. The application is used by a number of units in a variety of ways. For example, patrol supervisors can quickly identify where enforcement efforts must be focused; detectives can identify security cameras in proximity to crime events that may provide video of the crime; and fire and emergency management officials can plan for preparedness drills.
One of the primary challenges faced by public safety personnel at city-based institutions is the amount of thefts that occur inside buildings. Accordingly, UPenn is looking to include oblique aerial photography. With this feature, building administrators and DPS personnel would have the ability to view thefts in a 3D picture by each floor. This information would also help answer a variety of questions, such as: Who has access to the floor; when are the thefts occurring; what type of security is in place; and what former employee(s) may have had access to the floor?
The flexibility of GeoCAMS allows for continual technology enhancements. In turn, this helps all members of a community be aware of what is taking place around them, and enables individuals committed to improving safety to explore more intelligent crime analysis techniques. “GeoCAMS helps us look beyond our own geographical area to see the relationships that exist in adjoining communities,” Rush says.
This project has been successful for a number of reasons. When considering an investment in technology, such as the creation of a “Crime Analysis and Mapping Unit,” a department needs good leaders with vision. It must be willing to build partnerships, make necessary changes to the existing culture, conduct a needs assessment, select a good vendor offering a proven product, keep the project simple and always look for ways to improve.
Inspector Mitchell Yanak (retired) has served as director of PennComm since 2002 and manages the crime mapping and analysis unit, and is the project director for the records management system and mobile data terminals at UPenn. He previously served with the Philadelphia Police Department and can be reached at [email protected]. Kevin Switala is the director of public safety for GeoDecisions, an information technology consulting firm specializing in geospatial solutions. He can be reached at [email protected].
To subscribe to the unabridged print version of Campus Safety magazine, click here.